 duoyj · Case Study
Cup26Map: one map for a 104-match tournament.
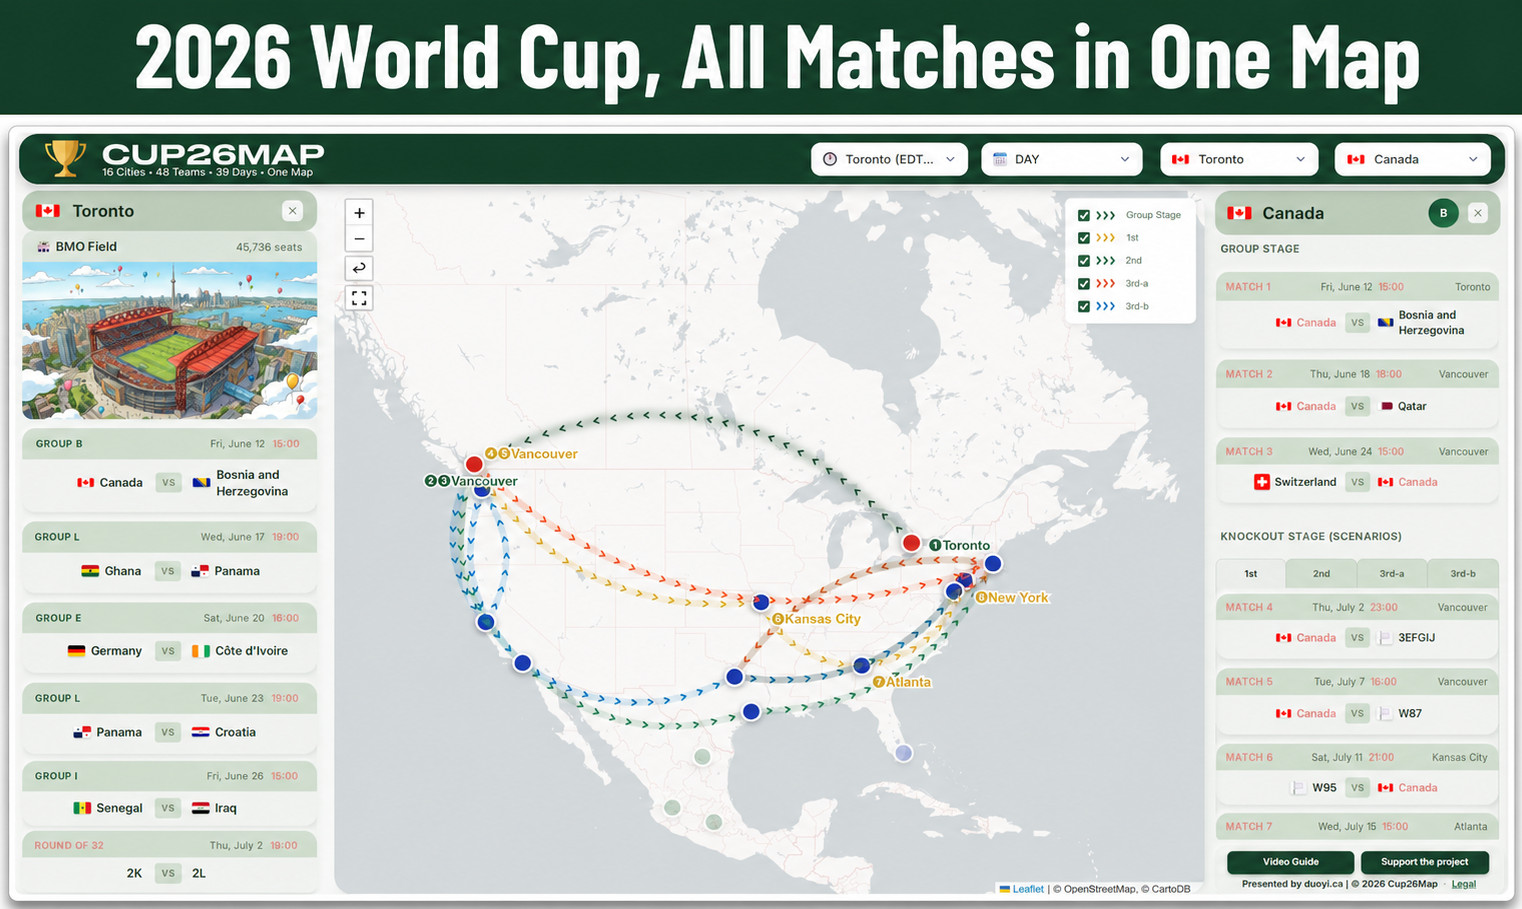
Cup26Map is an independent web app for the 2026 World Cup schedule. It connects matches, host cities, venues, teams, time zones, travel paths, and knockout scenarios so the tournament reads as a map, not just a long fixture table.
Independent fan-made project by duoyj. Not affiliated with, endorsed by, sponsored by, or associated with FIFA, the 2026 FIFA World Cup™, or official tournament organizers.
104
Matches represented: 72 group-stage games and 32 knockout fixtures.
16
Host cities across the United States, Mexico, and Canada.
48
Teams organized by group, city, date, and possible tournament path.
39
Days of tournament scheduling compressed into one map interface.
A tournament schedule rebuilt around place.
- Type
- Interactive event map / schedule explorer / fan travel planning aid
- Scope
- 2026 World Cup schedule, 16 host cities, 48 teams, group stage, knockout venue scenarios, local time conversion, city and team views
- Role
- Product concept, information architecture, map UX, data modeling, frontend build, responsive interaction design, SEO setup, and launch materials
- Core use case
- Answer who plays where, on which day, in which local time, and what that means geographically.
- Stack
- Next.js 16, React 19, TypeScript, Leaflet, React Leaflet, Tailwind CSS, static JSON data, URL-synchronized state, Vitest tests
- Status
- Live at cup26map.com
- Early signal
- After tracking was fixed, Cloudflare Web Analytics showed roughly 400 real visits per day at the start of the knockout stage, after bots and crawlers were excluded. Promotion was limited mostly to one Reddit post in r/IMadeThis, which reached about 36k views and 35 upvotes.
The schedule was available. The geography was hard to read.
A large international tournament is also a geography problem: cities, dates, teams, venues, time zones, travel routes, and bracket scenarios all interact.
Problem
Official schedules and sports pages usually show matches as lists: date, time, team, venue. That works when someone needs one fixture. It is weaker when they want to understand how the whole tournament moves.
For fans, travelers, local hosts, and curious viewers, the useful questions are spatial and comparative: Which matches happen in this city? Where does this team go next? How far apart are the venues? What changes if the team finishes first, second, or third?
The gap is simple: a table tells you the fixtures; a map shows how the tournament moves.
Solution
Cup26Map puts the tournament on a North America map and lets users enter from match day, city, team, or timezone.
The map, city and match-day sidebar, team schedule panel, and optional flight paths work together. A user can scan one date, open a city, follow a team's group-stage route, or inspect possible knockout paths.
The product turns one long fixture table into a spatial system people can move through.
A three-panel layout built around the map.
The interface is map-centered, but not map-only. Sidebars hold the structured schedule details; the map carries geography, venue distribution, and travel relationships.
CUP26MAP
16 Cities · 48 Teams · 39 Days · One Map
NED vs SWE
13:00 · Houston · LIVE
GER vs CIV
16:00 · Toronto
Design choices that made the schedule explorable.
The useful part is the connection between layers: time to place, team to route, city to venue, group stage to knockout uncertainty.
Map as the primary model
The map is not decoration. Geography is the interface, with city markers, match labels, and path overlays showing where the tournament happens.
Four ways to enter the data
Users can start from timezone, match day, city, or team, depending on the question they have: today's matches, Toronto's schedule, Canada's route, or kickoff time at home.
Sidebars for detail, map for context
The left sidebar carries city and match-day schedules; the right sidebar carries team schedules. The map keeps the geography visible while details stay readable.
Team travel paths
Selected teams are drawn across host cities with curved paths and directional markers, so the journey is visible instead of buried in separate fixtures.
Knockout scenarios as scenarios
Before results are known, the knockout bracket is uncertain. Cup26Map shows first-, second-, and third-place path options instead of pretending there is one fixed route.
Shareable state
Selections sync with URL parameters, so a specific team, city, day, and timezone view can be copied, shared, and reopened.
Now / Next layer
A live and upcoming match stack tells users what is happening soon while the map keeps the larger tournament context in view.
Responsive interaction
The layout adapts for mobile and compact screens, where sidebars, dropdowns, and map controls need different behavior than desktop.
Legal clarity
The footer and public copy clearly state that the project is independent and unofficial, which matters for a fan-made tool around a trademark-sensitive event.
Static data, derived paths, URL state, and a map-heavy frontend.
This is not just a visual mockup. It is a data-backed Next.js app with separate data models, utility functions, tests, and route-aware UI behavior.
System outline
Implementation details that matter
- Data repository abstraction: `JsonMatchRepository` reads local JSON today, while keeping the data access layer ready for an API or database later.
- Knockout bracket generation: R32 participants come from knockout venue data, and later rounds are traced through winner tokens such as `W73 → W90 → W97 → W101 → F_104`.
- Timezone conversion: match times are formatted against an IANA timezone, so users can read kickoff times in their chosen local context.
- Default selection logic: during the tournament window, the app can open on the next relevant match day instead of a generic starting state.
- Map view control: selecting teams, cities, and days adjusts the map view and highlighted cities, reducing manual panning and zooming.
- Score update workflow: the repo includes a CLI script for finding match IDs and updating scores during tournament-time maintenance.
- SEO structure: metadata, Open Graph image, structured data, city and team landing pages, and keyword targeting support search discovery.
The main design problem was deciding what belongs together.
Cup26Map works by connecting layers that are often split across separate schedule pages:
- Schedule layer: match date, kickoff time, group/stage, opponents, and venue.
- Geographic layer: host city, country, stadium, and regional distribution across North America.
- Team layer: group-stage matches, likely travel sequence, and possible knockout path.
- Time layer: local kickoff time converted into the user’s chosen timezone.
- Scenario layer: tournament paths that depend on group placement and bracket rules.
The bet is that a mega-event schedule becomes easier to understand when these layers appear together. The map is the organizing surface, not a backdrop.
Strong portfolio evidence, with an early real-usage signal.
Cup26Map is useful portfolio work because it shows complex event mapping, schedule data modeling, spatial storytelling, and interactive map UX in one product.
After an analytics configuration issue was fixed, Cloudflare Web Analytics showed roughly 400 real visits per day at the start of the knockout stage, after bots and crawlers were excluded. The complex group-stage planning use case had mostly passed by then.
The promotion behind that signal was modest: mainly one post in Reddit's r/IMadeThis, which reached about 36k views and 35 upvotes. That is not proof of monetization or long-term retention, but it does show the project found real use under limited promotion.
The honest reading is stronger than before, but still bounded. Cup26Map is a capability case study, a reusable event-map pattern, and now an early usage signal. Repeatable distribution and direct monetization remain separate questions.
High
portfolio value as complex event information architecture
Short
event window: value increases as the tournament approaches
≈400/day
real visits at the start of the knockout stage, after bots and crawlers were excluded
Open
direct monetization and repeatable distribution are still open questions
Reusable
pattern for conferences, festivals, sports events, heritage routes, and public programs
Independent fan project with clear boundaries.
Because the project relates to a trademark-sensitive sports event, the public presentation has to be careful. The page should not imply official status, partnership, sponsorship, endorsement, or organizer affiliation.
The live site already includes a legal disclaimer: it is an unofficial fan project and is not affiliated with FIFA, the 2026 FIFA World Cup™, or official tournament organizers. That disclaimer should remain visible in both the product and this case study.
For portfolio positioning, the emphasis should not be “official World Cup product.” It should be:
- interactive event mapping
- schedule + geography information architecture
- travel path and scenario visualization
- public-facing web app implementation
Why Cup26Map belongs in the portfolio.
Even while monetization and repeatable distribution remain open questions, Cup26Map shows useful skills for spatial web work, public data tools, event mapping, and civic or cultural information products.
Complex information architecture
Teams, dates, cities, venues, groups, stages, time zones, and bracket paths are organized into one navigable system.
Spatial UX and map interaction
Geography, view control, labels, sidebars, and path overlays make the event's complexity visible.
Data modeling and transformation
Static schedule data and bracket rules become derived views, URL states, and scenario paths.
Scenario thinking
Known group-stage fixtures stay separate from hypothetical knockout routes, preserving uncertainty instead of hiding it.
Event-map product pattern
The same pattern can fit conferences, festivals, public programs, heritage tours, multi-city sports events, or grant-funded cultural maps.
Public web product execution
The project has a live domain, SEO metadata, responsive layout, shareable views, video guide, support link, and legal disclaimer.
The strongest frame is an event-map engine, not a one-off fan site.
Cup26Map’s immediate topic is the 2026 World Cup. The broader capability is more general: turning large, distributed, time-sensitive public events into usable spatial interfaces.
That gives the project two jobs: serve as a public fan tool during the tournament window, and serve as a reusable portfolio case for spatial web work.
- 1Case-study first: treat the project as evidence of complex event information design, even while traffic is still early.
- 2SEO and timing: monitor Search Console and revisit promotion closer to the tournament, when search intent should be more active.
- 3Data story angle: publish one or two focused data stories, such as which teams travel the most or which cities host the densest schedule; find the fun facts in the video walkthrough.
- 4Reusable engine: describe the underlying pattern as a multi-city event map engine: schedule data, places, routes, scenarios, and shareable filters.
- 5Keep legal boundaries clear: keep fan-made and unaffiliated wording visible on all public-facing pages.
- 6Avoid overbuilding: avoid heavy features unless they clarify the event. The project's value is compression and orientation.
Need to explain a multi-location event or public dataset?
I am open to selected collaborations on event maps, civic and cultural mapping, open-data tools, and spatial web prototypes.